

Time To Execution Study
Posted: 8 August 2017
Introduction
The objective of a currency-hedged share class is to deliver the same local fund return to foreign investors, regardless of fluctuations in the exchange rate.
For example, a EUR based fund may offer USD share classes to American investors. Opening a hedged share class will attract investors who are interested in the fund, but are unwilling to take on uncompensated currency risk.
Figure 1. Currency-Hedged Share Class Objective
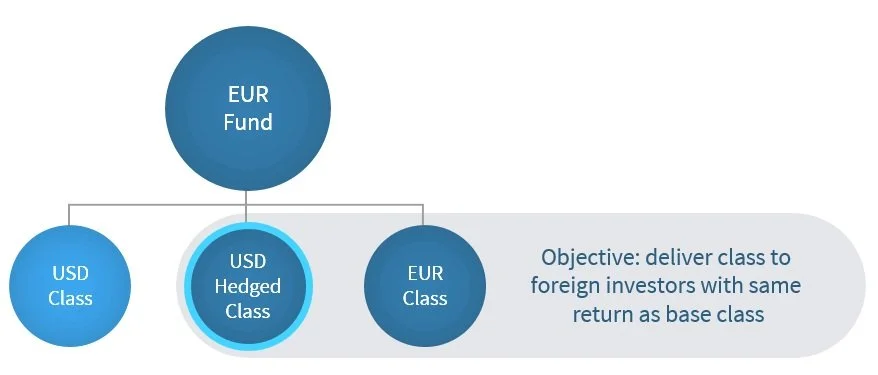

(Hypothetical Return Series)
While the objective of a currency hedged share class may be clear cut, the implementation of a share class hedge may be considerably hazy, with decisions that go into the design of the program having significant impact on how well the local fund returns are tracked. In this paper, we examine time to execution, a critical facet of implementation design.
Time to Execution
Time to execution is the amount of time that passes between the creation of a currency exposure and the execution of the corresponding hedge. While it may seem obvious a longer amount of time to execution increases the risk to the hedging mandate, this analysis seeks to quantify that additional risk.
For most share classes, the exposure to currency risk is created at the point of official valuation. Fund administrators calculate the TNA (total net assets) and NAV (net asset value) price of the class using a specific time of day as a valuation point. For classes that are priced in foreign currency, this also includes the use of a corresponding WM benchmark currency rate to translate the TNA and NAV price to the foreign currency. This is the inception of the currency risk for the hedged share class, and any unhedged exposure is immediately susceptible to changes in the spot rate.
As shown In Figure 2 below, there are many subsequent processing steps between this official valuation point and the execution of a hedging trade.
Figure 2. Typical Hedging Operations Timeline
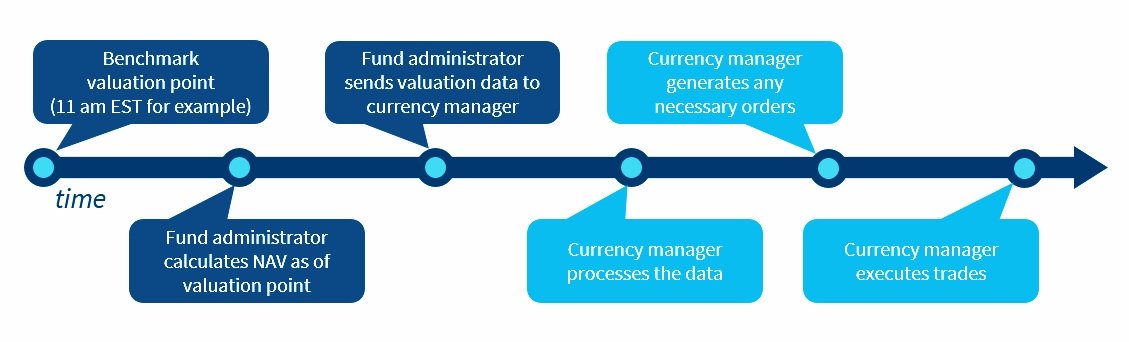
Every fund’s timeline can be different, but most fund administrators calculate and distribute the official valuations the day after the benchmarks rates are set. The currency manager (internal or external) must then process that data, generate any necessary orders, and execute the trades with approved counterparties. Frequently, this data is processed manually by the currency manager, and acted upon later in the day at a benchmark time that is unrelated to the share class valuation, and more related to price discovery. If the objective of the hedge is to offset any gains or losses due to currency rate fluctuation, any unhedged fluctuation prior to execution undermines that objective. Our research suggests that a more prudent approach is to take those trades to market as soon as they are validated, and to employ pre-trade and post-trade cost analysis to validate executions done away from benchmark times.
Figure 3 below demonstrates this relationship with time, presenting the standard deviations of spot rates between 11 am and 4pm, as well as 8 am, 11 am and 4 pm the following day (Eastern Standard Time). We calculated standard deviations for seven major currency pairs using daily observations from 2008 to May 2017. While most deviation occurs overnight, there is also a measurable amount of intraday risk throughout the following day. On average, trading at 8 am the next day results in less deviation than waiting to trade until 11 am or 4 pm.
Figure 3. Intraday Spot Rate Deviation (2008 through May 2017)
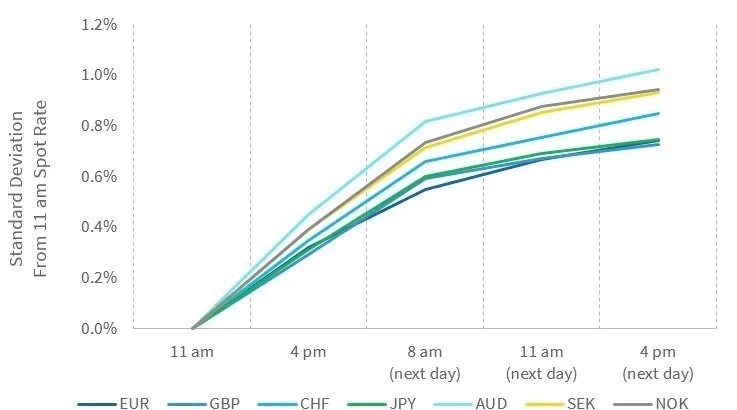
Source: Bloomberg FIX rates
In Figure 4, we present the full distribution of deviation in spot rates from the 11 am benchmark. As more time passes, the distribution shifts away from 0% deviation and into the higher risk tails.
Figure 4. Distribution of Rate Changes Relative to 11 am EST (2008 – May 2017, all seven currency pairs)

Using the above distribution, Table 1 breaks out the likelihood of a smaller rate change less than 0.25% as well as a larger rate change of greater than 1%. Trading at 4pm the same day resulted in a smaller change in rates 69% of the time. This likelihood declined to 41%, 34% and eventually 32% throughout the following day. Conversely, trading at 4pm the same day also resulted in a larger rate change only 2% of the time. The risk of a larger than 1% rate change increased from 10%, 15% and eventually 18% over the course of the following day.
Table 1. Likelihood of Smaller and Larger Rate Deviations

Although in theory this rate deviation could result in either a gain or loss for the share class, any deviation should be considered a detriment to the investment objective. To the extent possible, hedging programs should be designed to trade as soon as the official valuation data is available and validated, to reduce performance slippage for the hedged share classes.
Illustrative Example
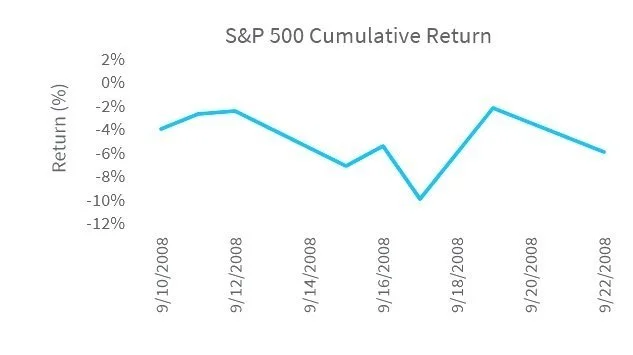
The exercise below utilizes actual S&P 500 returns and Bloomberg FIX spot prices around the Lehman bankruptcy filing on September 15, 2008. Although this was an extreme period in terms of asset and currency volatility, it is useful for highlighting the potential risks associated with delayed execution.
For this example, we assume that there was a GBP hedged share class invested in a USD S&P 500 fund. The hedge ratio for this hypothetical share class was permitted to drift between 98% and 102% before a rebalance trade was required (a typical range for equity funds). We measured the impacts to the class performance for trading any required rebalances at 8am, 11am or 4pm the following day.
As seen in Figure 5, there were multiple days with S&P 500 returns over 3% in either direction during this period. This would have resulted in frequent breaches of a 2% hedge ratio filter, depicted by the light blue dots in the hedge ratio chart below.
Figure 5. S&P 500 Returns and Resulting Hedge Ratios
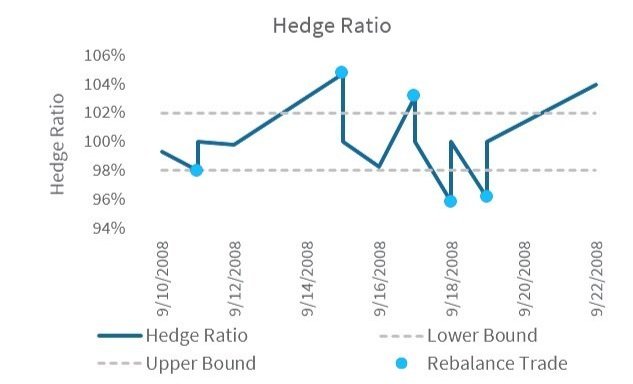
For each of these breaches, a rebalance trade would be needed to increase or decrease the hedge position to bring the hedge ratio back to the target of 100%. We look at each of these five rebalances in figures 6-10 below, and measure the impacts to the fund from delayed execution at 8am, 11am or 4pm on the following day (source: Bloomberg FIX rates).
Our analysis indicates that there would have been a significant reduction in performance impacts and tracking error by trading at 8am relative to trading at 11am or 4pm.
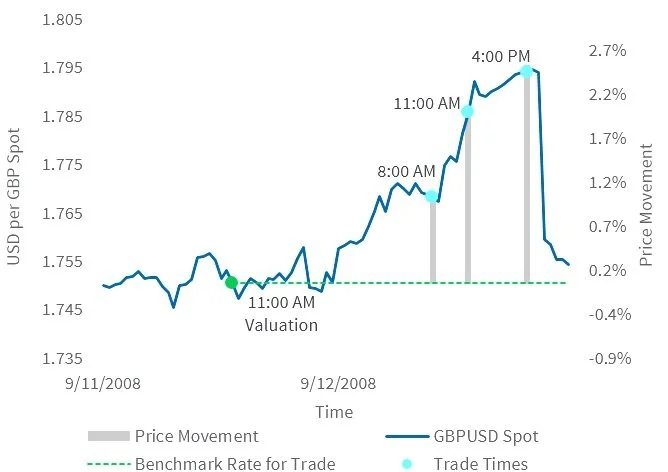
Figure 6. Hedge Ratio Breach on September 11, 2008, Rebalance Trade Execution on September 12, 2008
9/11/2008 Hedge Ratio = 97.98%
Triggers sell USD, buy GBP = 2.02% of assets
Market rates all increase as GBP strengthens
Buying GBP at higher rate results in loss
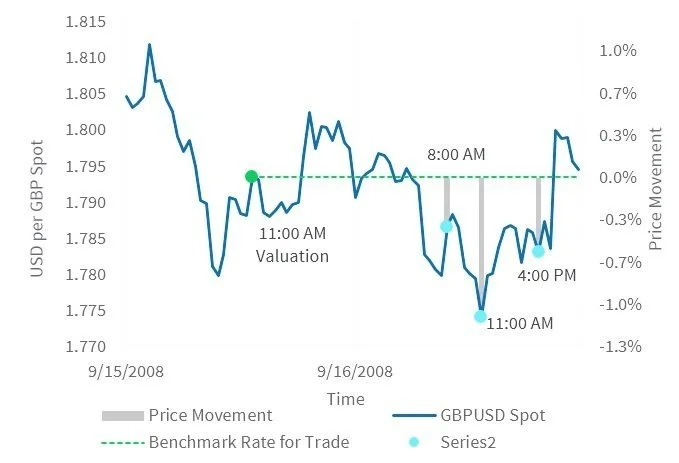
Figure 7. Hedge Ratio Breach on September 15, 2008, Rebalance Trade Execution on September 16, 2008
9/15/2008 Hedge Ratio = 104.72%
Triggers buy USD, sell GBP = 4.72% of assets
Market rates all decrease as GBP weakens
Selling GBP at lower rate results in loss

Figure 8. Hedge Ratio Breach on September 17, 2008, Rebalance Trade Execution on September 18, 2008
9/17/2008 Hedge Ratio = 103.14%%
Triggers buy USD, sell GBP = 3.14% of assets
Market rates all increase as GBP strengthens
Selling GBP at higher rate results in gain
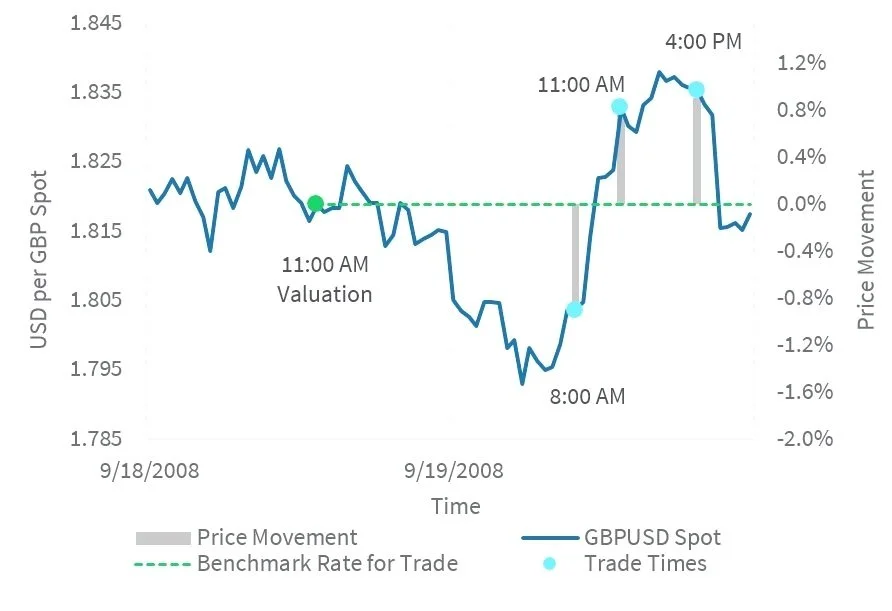
Figure 9. Hedge Ratio Breach on September 18, 2008, Rebalance Trade Execution on September 19, 2008
9/18/2008 Hedge Ratio = 95.85%
Triggers sell USD, buy GBP = 4.15% of assets
Market rates increase as GBP strengthens
Buying GBP at higher rate results in loss
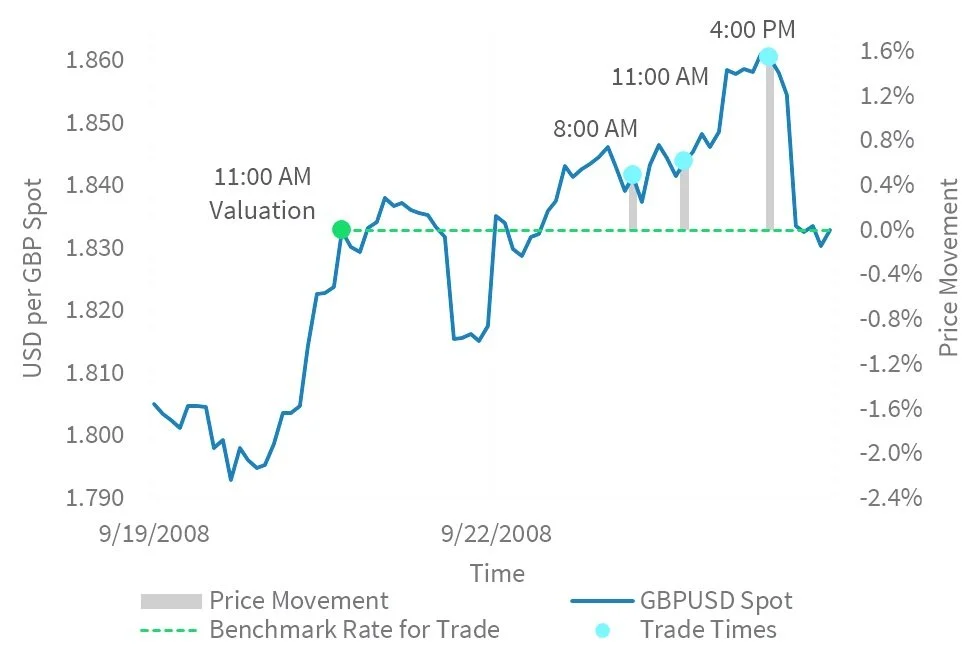
Figure 10. Hedge Ratio Breach on September 19, 2008, Rebalance Trade Execution on September 22, 2008
9/19/2008 Hedge Ratio = 96.13%
Triggers sell USD, buy GBP = 3.87% of assets
Market rates all increase as GBP strengthens
Buying GBP at higher rate results in loss
Table 2 below details each rebalance, and the impact to the share class caused by execution that was delayed until 8am, 11am and 4pm on the following day. The impact is calculated by multiplying the size of the trade (as a percent of the class size) by the change in spot rate. Trading at 8am minimized the impact to 2 basis points in positive slippage, while trading at 4pm resulted in 14 basis points of negative slippage.
Table 2. Example GBP Hedged S&P 500 Share Class: Impacts due to delayed trading

Although these conditions are not typical, over the course of many months and rebalances, smaller daily impacts have the potential to add up to large impacts over time. Lumint ran full simulations for this same example hedged share class from 2012 to mid-2017. On average, trading at 8am reduced performance slippage by over 10 basis points per year. For passive equity and fixed income strategies that closely track benchmarks, this level of uncompensated and unnecessary risk can have a large impact on the attractiveness of your hedged share class to foreign investors.
Legal Disclaimer
This case study (“Study”) is for informational purposes only and does not constitute the provision of investment advice. This Study is solely intended for persons who are “eligible contract participants” and “qualified eligible persons” under CFTC regulations. Lumint does not accept customers who are not “eligible contract participants” and “qualified eligible persons." Nothing herein shall imply that information contained herein is correct as of any time subsequent to the date of this Study. This Study expresses no views as to the suitability of the products or strategies described herein for the reader of the Study or to the individual circumstances of such reader or otherwise.
This Study shows simulated results, not actual transaction results. Simulated results may be unreliable because they may reflect the application of hindsight. Simulated results should not be relied upon as an indication of future performance. Past performance, and in particular simulated results, is not a reliable indicator of and is no guarantee of future results. Returns may fluctuate with market conditions and every investment or strategy has the potential for loss as well as profit.
Certain information presented herein constitutes “forward-looking statements” which can be identified by the use of forward-looking terminology such as “may,” “will,” “should,” “expect,” “anticipate,” “project,” “continue” or “believe” or the negatives thereof or other variations thereon or comparable terminology. Any projections, market outlooks or estimates in this Study are forward-looking statements and are based upon certain assumptions. Due to various risks and uncertainties, actual market events, opportunities or results or strategies may differ materially from those reflected in or contemplated by such forward-looking statements and any such projections, outlooks or assumptions should not be construed to be indicative of the actual events which will occur.
The source for all figures included in this Study is Lumint, unless stated otherwise. While all the information prepared in this Study is believed to be accurate, Lumint may have relied on information obtained from third parties and makes no warranty as to the completeness or accuracy of information obtained from such third parties, nor can it accept responsibility for errors of such third parties.