Data Visualization
Closer look: Performance Prism™
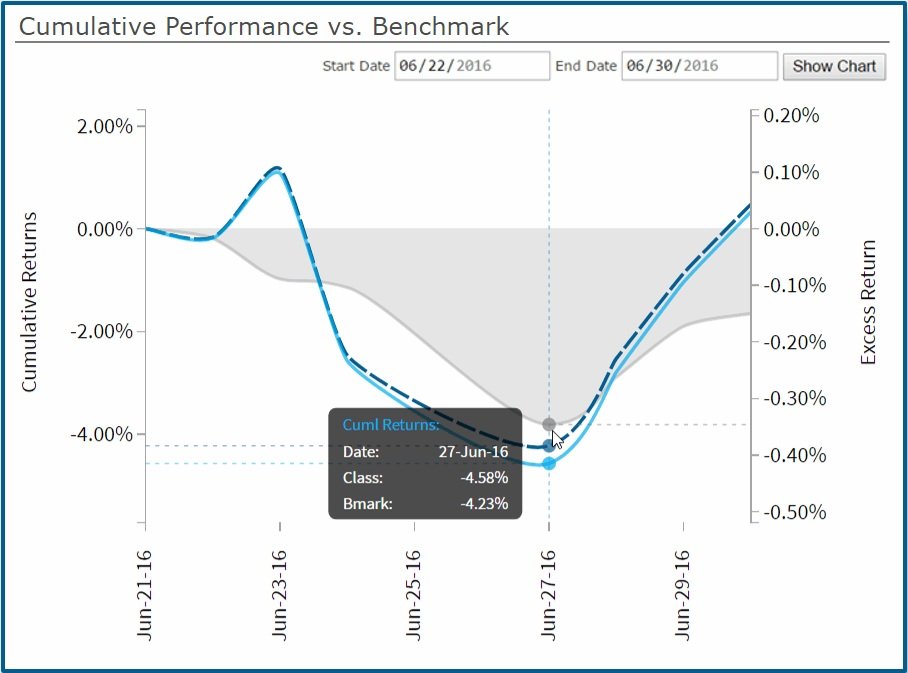
View performance of hedged accounts relative to their benchmarks in real-time.
Select any date range in the account's history.
Hover over the chart to get cumulative returns and slippage for each day.
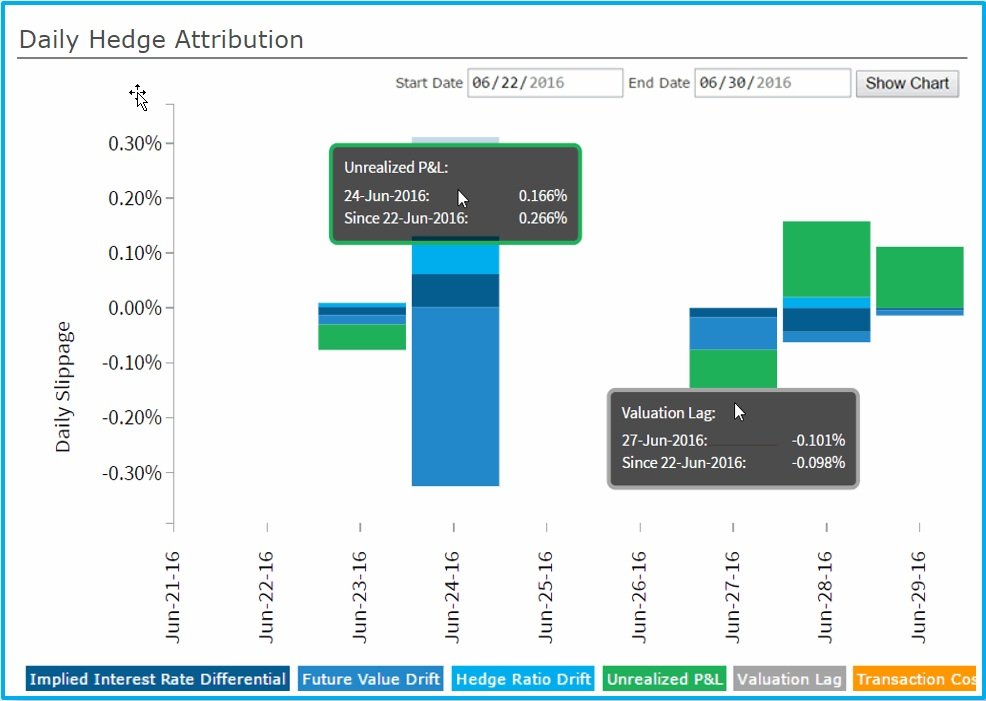
View contributions from each factor to performance slippage on a daily basis.
Click into any bar to view additional detail.
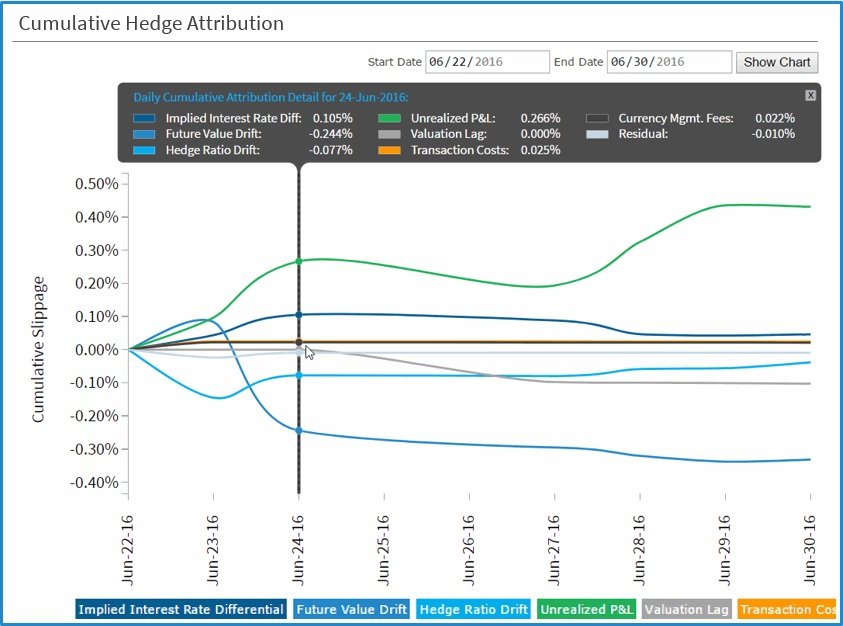
Track cumulative contributions to slippage from factors over time.
Click into any day to see precise values.
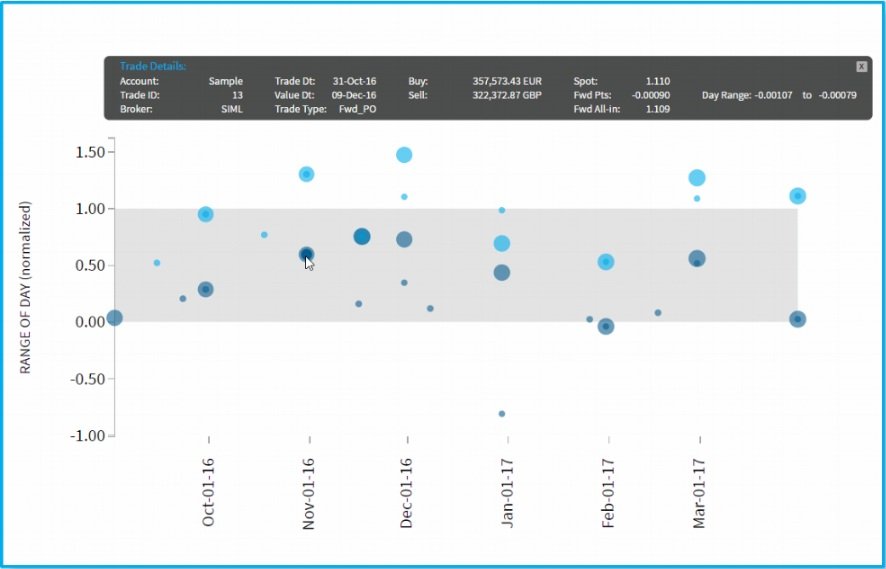
View trade prices relative to a normalized benchmark range of day for spot or forward points.
Trades are color coded by buy/sell and relatively sized.
Click into trades to view trade details.